This post is a fairly blatant attempt to lure you in with some data, and while you’re here, remind you that we’ve launched our annual production survey. The Beer Industry Production Survey (BIPS) is the deepest statistical resource we have at the Brewers Association (BA) and will be the source of many posts with even more data than this one in the future. If you have a few minutes, please provide us with your 2021 numbers.
I’d be a bad survey host if I didn’t give you the data I promised in the first place. In this case that’s a quick update on what scan data, as well as a couple of on-premise data sources, showed for the October, November, December (OND or Q4) period for craft beer, traditionally a critical quarter for many brewers.
The short version is that scan data shows:
- Craft dollar share within beer similar to 2019 and slightly below 2020, with not much change from the third quarter (Q3)
- Overall dollar sales levels that still exceed 2019 by a decent margin but that slightly lagged 2020
- OND actually looked slightly better in absolute terms versus Q3 for BA craft, though it still trailed the overall beer trend
For the first bullet, here is BA craft dollar share by quarter in IRI scan data, including total U.S., multi-outlet plus convenience (MULO+C) and liquor, for 2019-2021:

While OND isn’t the strongest beer selling period of the year, it is the highest share period for craft, hence the importance for many brewers. Craft share has been fairly stable and Q4 looked a lot like Q3. Performance was similar (Q3 is different due to rounding, but not that different) and only slightly below 2019.
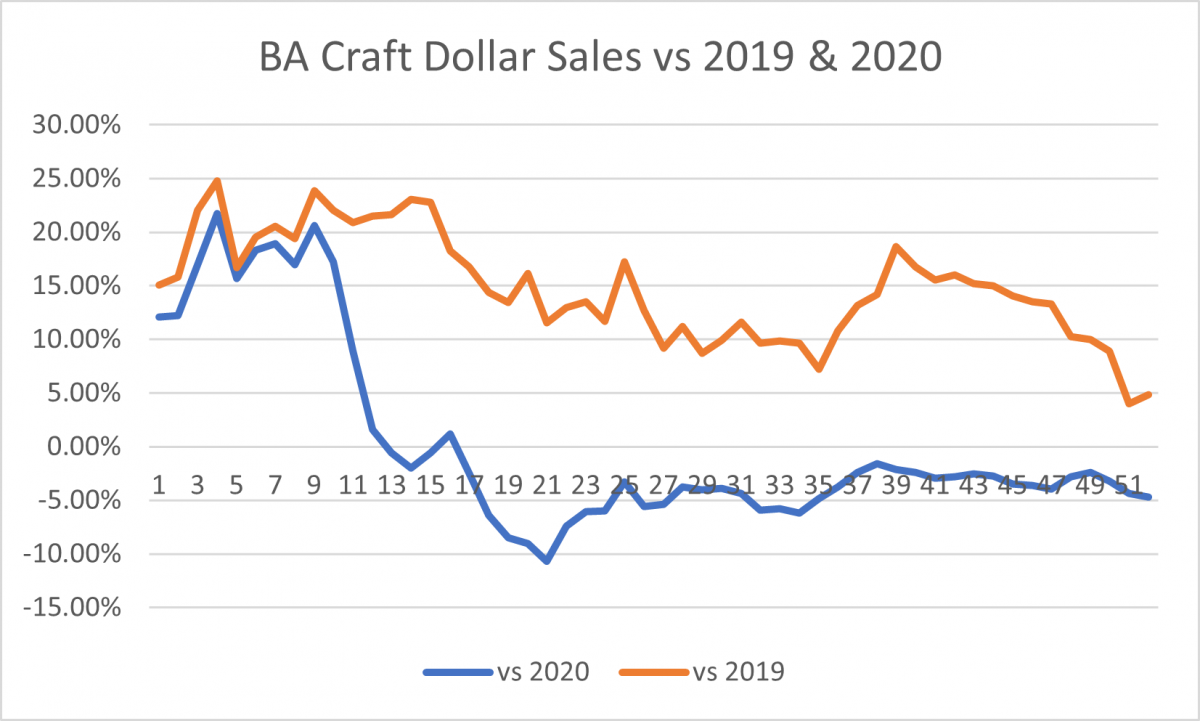
Looking at absolute levels (shown below as a smoothed four-week rolling average versus previous years), we see the clear divergence in comparing this year to 2019 (pre-pandemic) versus 2020 (pandemic logic). As you can see, craft packaged sales are still elevated versus pre-pandemic, though that did decline throughout the OND period.

BA craft dollar sales averaged -3.2% below 2020 levels in OND, which was an improvement from -4.2% in Q3. It also slightly improved versus 2019, up 12.1% in OND versus 11.1% in Q3 (note: the weakness at the end of the year makes this kind of hard to see visually, a sign visualization isn’t always the best way to pick up these trends). Overall beer was down -2.2% in Q4 versus 2020 and -2.2% in Q3, so craft is moving around a bit more in its trend.
We don’t really have a full complement of OND numbers for on-premise yet, but the early numbers we do have from October suggest that the on-premise recovery stalled a bit. Given some of the labor market and general retail numbers we’re seeing for November, coupled with the rise of Omicron, I wouldn’t expect that to improve much when we get more definitive November/December numbers, and in fact trends might even weaken slightly. I talked about the graph below more in my recent Collab Hour, so if you want to learn more, watch that or feel free to reach out.

To close, OND feels like it may end up being a pause on any recovery. I suspect the relatively stable off-premise can numbers are going to be reflected in fairly consistent on-premise numbers. That likely ends 2021 in a better place than craft was for most of 2020 and 2021, but still lagging its previous draught sales, and with packaged sales that are perhaps starting to trend back toward 2019 level (though, as noted, were actually stronger versus 2019 than Q3). The final big piece is at-the-brewery sales. We’ll learn more about that through our survey (please fill it out!) and as I dive into a new point of sale (POS) dataset that I’m hoping to write up much more on soon.


 Resource Hub