If you’ve read the beer trade press in recent weeks, you might have the sense that May was not a great month for the craft category. And, if your frame is scan data and your only comparison is 2020, you’d be right. That said, this is a reminder that 2020 was not a normal year, and so reporting scan data versus 2020 may not, in fact, really provide that much context for the beer category or sub-categories within the beer category. Taking a step back and remembering what scan covers and where it fits into the overall picture, I think it quickly becomes clear that we shouldn’t read these numbers in a vacuum, with little to no context as to why they might be that way, and that it’s quite plausible that for many brewers, a weak year-over-year May in scan for craft is actually a really good sign.
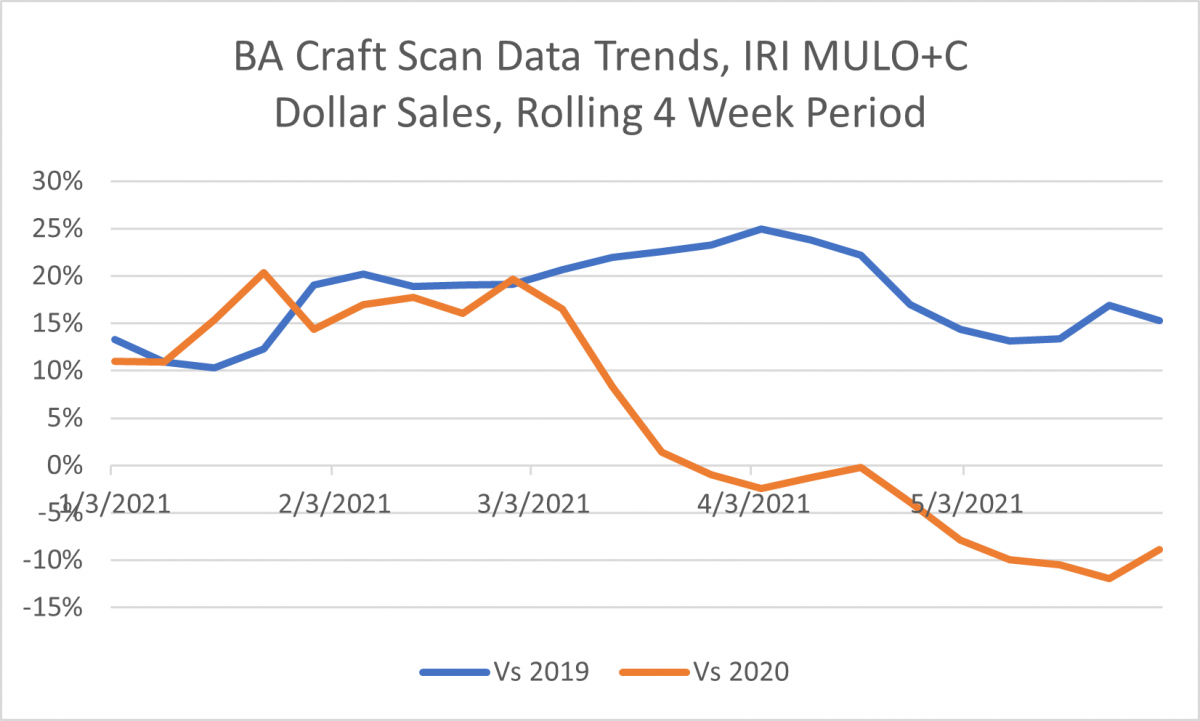
To start, here’s a graph with current four-week rolling dollar sale trends in 2019 versus 2020.

The point in 2020 where the U.S. shut down and we lived through (hopefully) the weirdest period any of us will ever experience is quite clear. This graph also shows us how little comparing to 2020 really tells us by itself. BA craft is still up 15% versus 2019 in May, which alone, would also be really tough to interpret. So, is craft doing well or not right now?
To really know that, it’s probably better to A) look at share data within scan, and B) try to balance any scan data with on-premise trends to understand their interaction and the total picture.
On the first, craft share is much more stable (which, to be fair, has been included in many of the trade press articles). Here’s Brewers Association (BA) craft from IRI multi-outlet and convenience (MULO+C). Which one is 2020 and which one is 2021?

Looking at it this way shows that independent craft is earning a very similar share of the pie as it was last year during these weeks, so that if there are changes in growth, it’s due to the size of the pie (and in this case probably the shopping habits of consumers), more than it is due to any fundamental changes in demand for craft. As a side note, while there are differences between Nielsen and IRI scan data, the non-BA craft numbers I’ve been reading in the trade press show a much bigger share decline than the one above. Maybe that’s a story to delve into?
The second thing that’s really important to keep in mind right now is the interaction between on- and off-premise. In normal times, growth in scan showed something (though not everything) about sales trends that could reasonably be compared over time. But as we saw in reverse in 2020, much of what we were measuring last year was how much of the volume lost from bars and restaurants was flowing into packaged volume at grocery, convenience, and liquor stores.
This year is the reverse. That means for most breweries, all of this doesn’t really matter until we understand how this interacts with the on-premise. Craft over-indexes in the on-premise relative to basically every other category, meaning it’s going to be more sensitive to these flows in traffic than many beer categories. The shift from on- to off- last year was generally bad for craft—BA craft was down 9% in a year where the scan numbers were up by double-digits. So it stands to reason that it might be good for many breweries that craft is dropping in scan, precisely because it means people may be going out again finally!
The latest Nielsen CGA survey numbers suggest this might be the case, showing 38% of consumers plan to go out for a drink in the next two weeks (June 4-7). That number a month ago (May 7-10) was only 25%. We don’t have sales numbers to back up those surveys, but if draught volumes see an increase of 50% relative to the latest numbers, that’s going to be a net positive for many brewers, even with these scan numbers. As a corroborating data point, the May 2021 NBWA Beer Purchaser’s Index for craft sat at 65. It was 42 in May 2020 when craft scan numbers were soaring.
So, to close, I propose a rule on reporting scan trends going forward: no mention of scan trends without A) including the comparison to 2019 (a cheers to Nielsen IQ who is putting these in their reports right now), or B) when talking about category trends, attempt to tie it into the on-premise. Those points of context will go a long way to help everyone figure out where craft is relative to where it was, as well as relative to other categories within beer.


 Resource Hub