Media reports on beverage alcohol often use data in inconsistent or misleading ways to tell a narrative. I’ve already written about this in relation to sales during the pandemic. Yes, grocery stores sales of beverage alcohol are way up, but the picture for total beverage alcohol is less clear. To quote from Nielsen in their newsletter this week:
“While off premise growth rates for alcohol continue to outpace growth rates of total consumer goods, we reiterate that the off-premise growth is not enough to make up for the total losses in on-premise channels. There has been a significant shift in volume from on-premise channels, which has exaggerated growth rates for off-premise alcohol.”
Americans are buying more alcohol at the store, but that’s at least partially (if not wholly) because they are buying less at bars and restaurants. We can see this in other industries. For example, they are also buying more vegetables. I have yet to read a headline declaring that “Americans Are Turning to More Leafy Greens to Cope with Pandemic” like those I’ve seen about beverage alcohol.
I open with this idea, because I wonder if it is a contributing background factor to another statement that I see cropping up more in the media: the assertion that Americans have been drinking more over a period of decades. The Wall Street Journal recently quoted a “20-year rise in Americans’ drinking.” Ironically, many of the same publications that have included this idea in their pages in recent weeks were writing about Americans drinking less alcohol in the last few years.
At an absolute level, the statement that Americans drank more in 2019 than in 1999 is correct, but then again, there are a lot more Americans to do the drinking versus 20 years ago. The U.S. 21+ population was 190.9 million in 1999 growing to 242.0 million in 2019. Given this rise, we can also look at beverage alcohol servings on a per capita level (21+), and there we find that Americans are drinking a bit more, with a per capita rise of around 6% between the 20-year gap (0.3% annualized). For context, about two thirds of Americans drink, and this works out to around one additional drink per week for every American who drinks.
But when we take a step back and look at the data more comprehensively, this case weakens. First, what year you pick matters. 20 years seems ideally picked to prove a case you want to make. If you said 30 years, per capita consumption is down 5%. If you picked ten years, it’s up, but only 1%.
Using data on historical beverage alcohol servings from bw166 and population data from the U.S. Census Bureau, I plotted beverage alcohol servings per capita for every year from 1970-2019 (you can also find an analysis by bw166 here). In the 49 years between 1970 and 2018, Americans drank more per capita than they did in 2019 in 24 of those years and less in 25. To be fair, if we limit ourselves to just the last 20 years, Americans only drank more in only three of those years and less in 17, but in 10 of the 20 years per capita consumption was within 1% of what it was in 2019. In other words, even if per capita consumption was a bit higher in 2019, per capita levels have been remarkably steady.
In addition, digging in, we can explain a huge amount of the changes in recent decades based on pretty simple factors. Imagine you are sitting in an introduction to research methods class and the professor tells you that per capita beverage alcohol consumption went up 6% over 20 years. How would you scrutinize that statement? What is different between Americans and America in 1999 and 2019 that might cause that change? In addition to investigating why they picked those two particular years instead of looking at the full data, you might immediately think of the changes in the demographics and economics of the U.S. over a few decades. In 1999 there were baby boomers who were younger than the oldest millennials are today while Pets.com was in the Macy’s Thanksgiving Parade and planning their Super Bowl commercial.
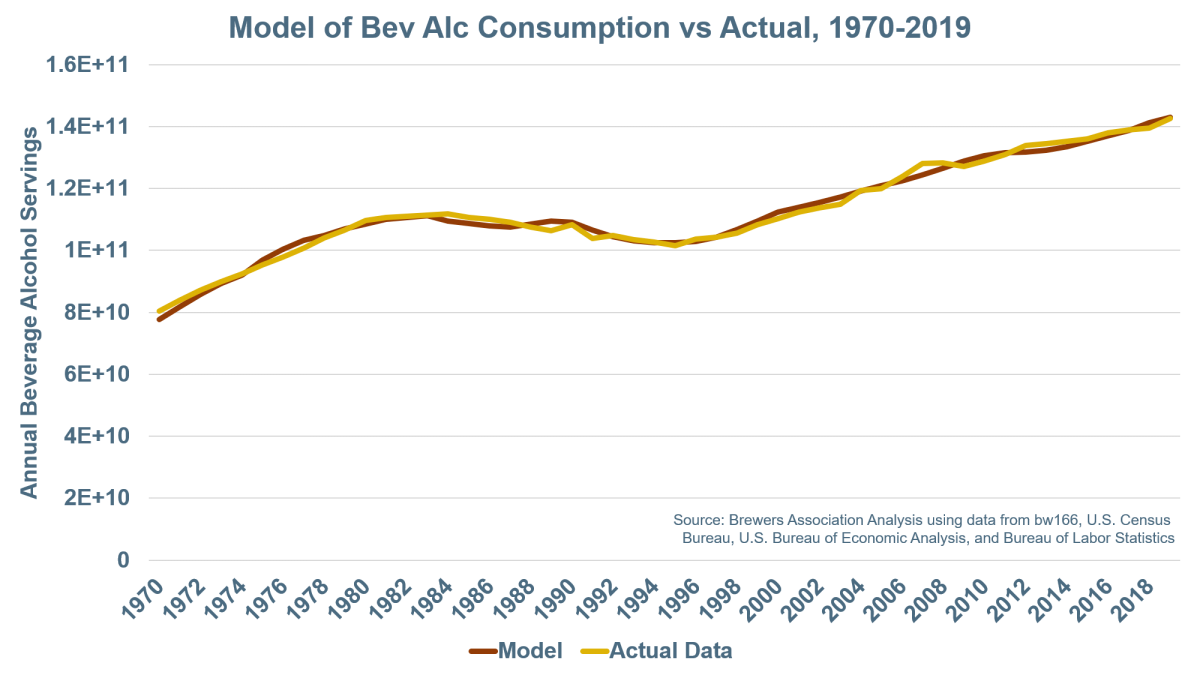
Here’s a graph showing a model of beverage alcohol servings that has seven inputs: five that are just population numbers by age (source: U.S. Census Bureau) and two that are economic factors:
- Legal drinking age 18-20 year old population (the drinking age changed a lot in the 1970s and 1980s)
- Non-legal 18-20 year old population (see above)
- 21-34 year old population
- 35-64 year old population
- 65+ population
- Real personal consumption expenditures (Source: U.S. Bureau of Economic Analysis)
- Male 20-34 year old unemployment (Source: Bureau of Labor Statistics)

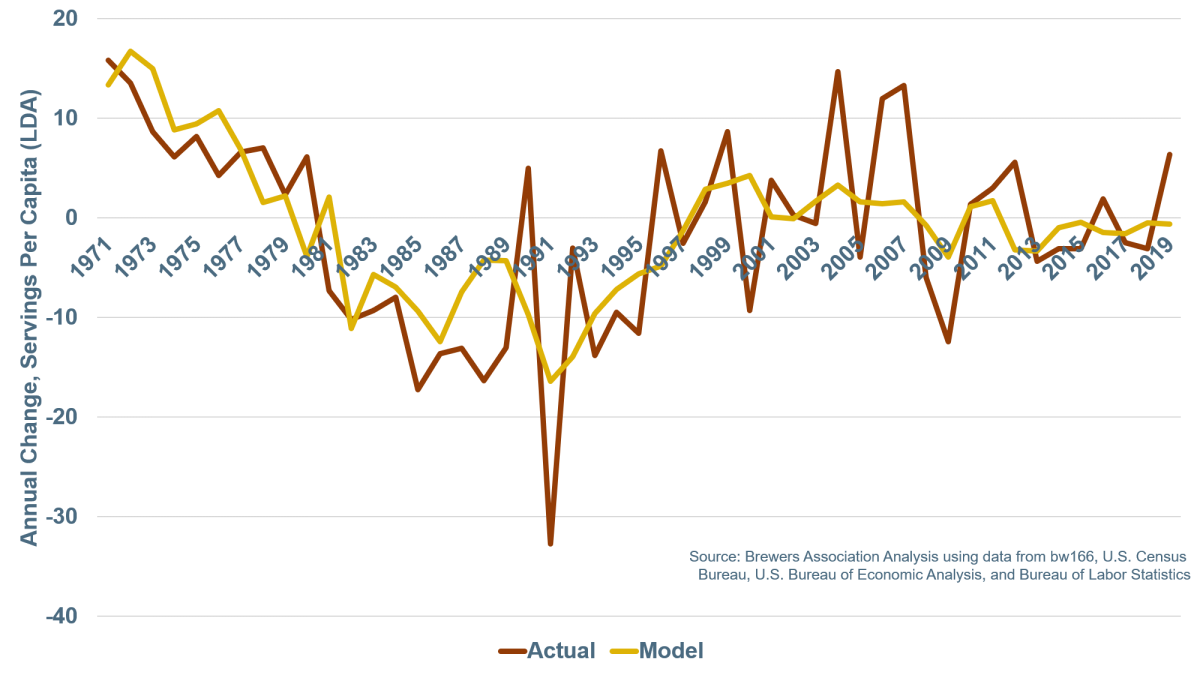
What it shows is that the number of beverage alcohol servings has tightly matched the population size, their age distribution, and a few basic factors about the economy. Or if you prefer, here’s a model of the year-over-year changes using the annual changes in the same variables.

You can also do this looking at changes on a per capita level.

I’ll stop there, as I’m not trying to bury you in statistical models, but I hope to make two main points in laying this out. The first is that saying “beverage alcohol consumption is up over 20 years” is a weak analysis that even from a market perspective doesn’t really tell us that much about the why or any real insight into what we might expect next.
The second is that even if consumption levels or even per capita consumption levels are useful from a market analysis perspective, they still are only a partial picture about the distribution of that consumption across the population, and so are poor proxies for talking about public health issues.
To close with that public health perspective, there are valid concerns about responsible drinking that the absolute, highly aggregated data that is often presented in the media tells us very little about. For example, a decline in per capita consumption levels could be a negative for public health if it coincides with a rise in binge drinking or underage drinking in the same way a rise doesn’t necessarily raise public health concerns depending on its distribution.
In the same way I analyzed the demographic and economic factors driving beverage alcohol consumption above, reports that want to speak to beverage alcohol in relation to public health should break them apart and look at the issues that we really care about. Understanding the distribution of beverage alcohol consumption (across people, occasions, locations) and what percentage is responsible use is far more important than how much Americans drink overall – which I’ve hopefully convinced you is A) fairly steady and B) highly related to other economic and demographic variables.
In understanding these factors better, we can also look for changes that matter for what we really care about. If 65+ drinking is a health concern, what does that data show? What does the data show on underage drinking levels? Focusing only on total levels not only misses the explanatory variables, it often misses the questions that are truly important for public health and tracking responsible consumption.


 Resource Hub