Summary
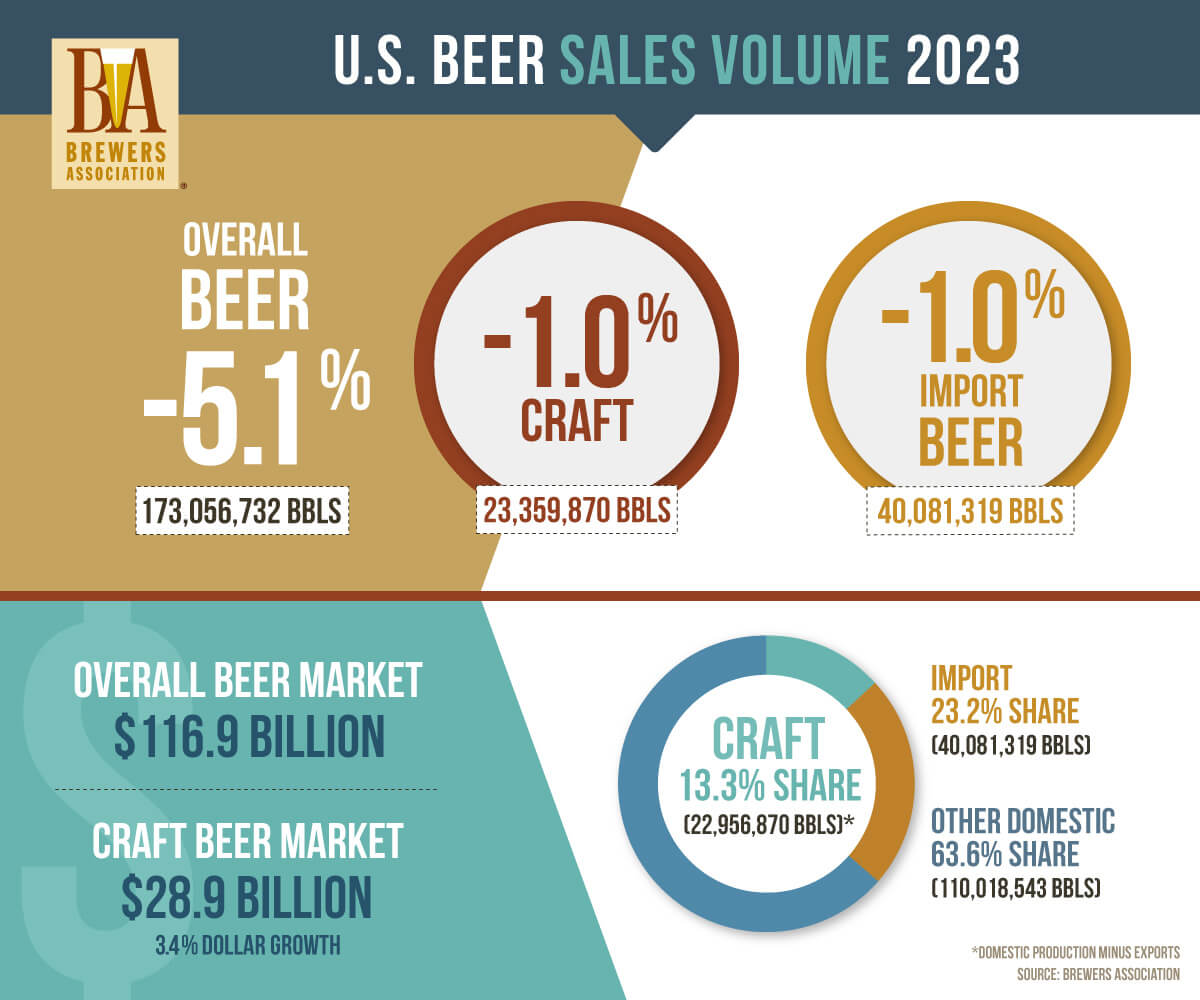
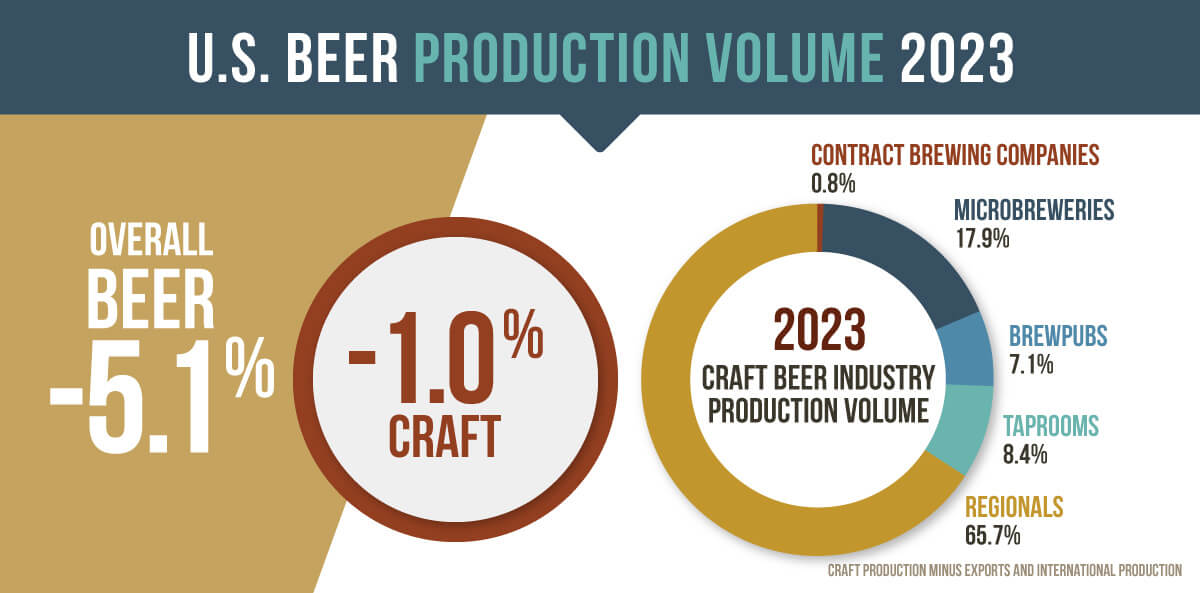
Overall U.S. beer production and imports were down 5% in 2023, while craft brewer volume sales declined by 1%, raising small and independent brewers’ share of the U.S. beer market by volume to 13.3%.
Retail dollar sales of craft increased 3%, to $28.9 billion, and now account for 24.7% of the $117 billion U.S. beer market (previously $115 billion). The primary reasons for the larger dollar sales increase were price increases and slightly stronger onsite sales growth versus distribution.
These statistics use the craft brewer definition of a small and independent brewer, as well as six craft beer industry market segments as defined by the Brewers Association. More up to date statistics and analysis can be found in the Insights & Analysis section of the website.
Sales Data
Production Data
Historical Craft Brewery Production by Category
1 barrel = 31 US gallons
Historical U.S. Brewery Count
Slide the bar at the top of the graph to see number of breweries from 1873 to present day.
U.S. Craft Brewery Count by Category
Recent U.S. Brewery Count
Brewpub Openings and Closings
Micro Openings and Closings*
* Starting in 2019, Taprooms are their own separate category, so for comparable numbers, add 2019 taproom numbers.
Taproom Openings and Closings*
Contact Us With Questions About Industry Statistics


Full Report
Comprehensive reports and analysis of the national beer sales and production data are available in the May/June issue of The New Brewer, the journal of the Brewers Association, released in mid-May each year. The issue can be purchased in the Brewers Association online storeOpens in new window.
 Resource Hub